Expona
Context-trained AI agent delivering noise-free, cost-efficient conversational intelligence


 expona
A couple of weeks ago, I was in a huge dilemma. I had to showcase a dashboard with multiple reports spanning across Cases, Contacts and Accounts on my portal landing page, each one with a different dashboard component. Additionally, the displayed reports should only contain the graphical part and exclude all the other irrelevant details. Since this facility is not available in Salesforce, like most developers, I instantly thought of using ‘iframes’ in my Visualforce page. But alas, that proved to be quite an issue ridden solution! Visualforce charting was also another alternative I considered and then discarded, for it would have been a time-consuming task. That’s when Reporting API, with its effective UI and quick implementation lifecycle came to my life as my savior.
Salesforce introduced a limited feature pilot of Analytics API in Summer ’13 and the Analytics REST API was made generally available from Winter ’14. The Analytics API allows us to integrate Salesforce report data into apps programmatically and has several resources that let you query metadata, and record details. This API is based on REST, which means that all the information that a user needs is generated real-time. The Reporting API is part of all the available REST APIs generated by Salesforce.
Salesforce has provide multiple ways to display charts, namely Standard Reports and Visualforce Charting. However, Visualforce Charting requires controllers and test classes, and uses JavaScript to draw the charts. Standard Reports have their own set of drawbacks, their rigid format being a primary road-block.
On other hand, Reporting API has abundant advantages, including real time display of data. The <analytics: reportChart> tag, along with a Report Id will display the report chart of the associated report. Additionally, the users have an option to run reports synchronously or asynchronously.
Most importantly, users can get a Single-View representation for multiple objects.
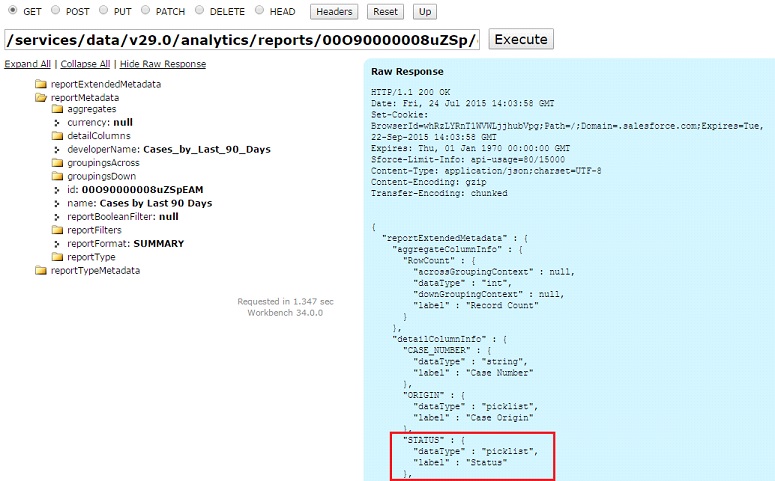
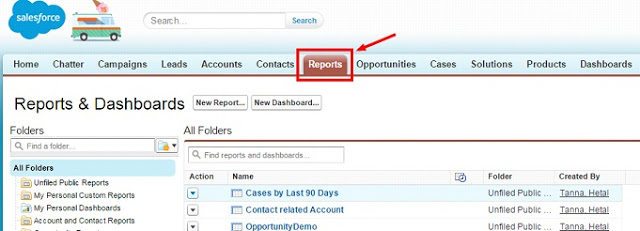
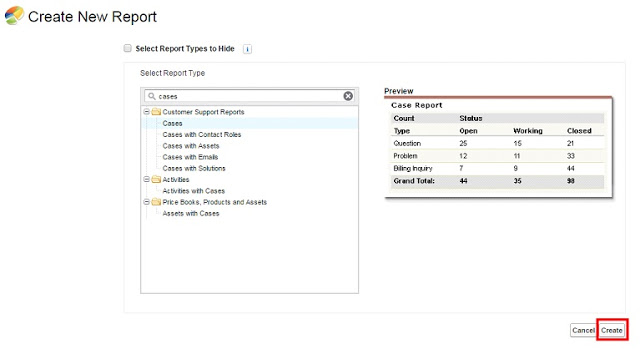
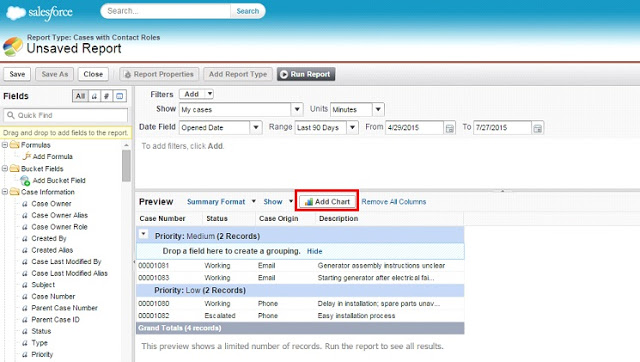
Creation of a Report
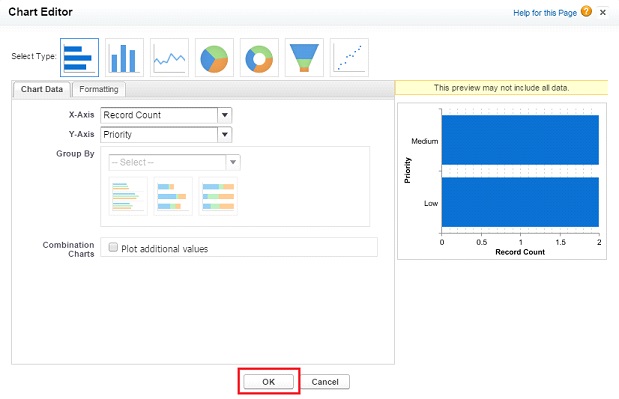
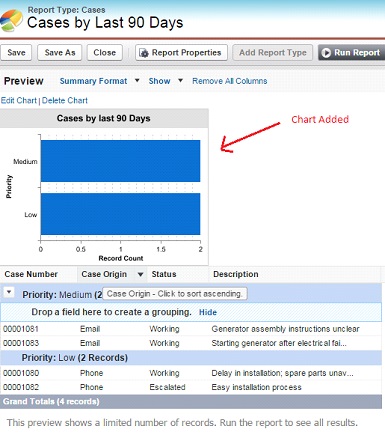
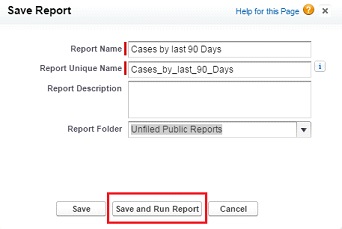
Note:
This will display the report chart associated with your report in the page, thus allowing you to create a custom dashboard.
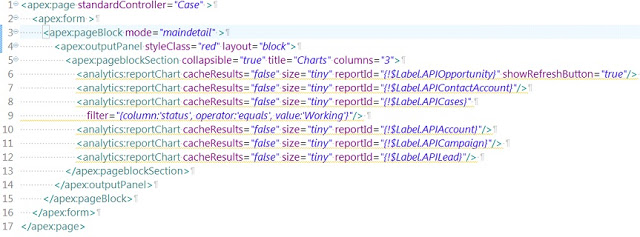
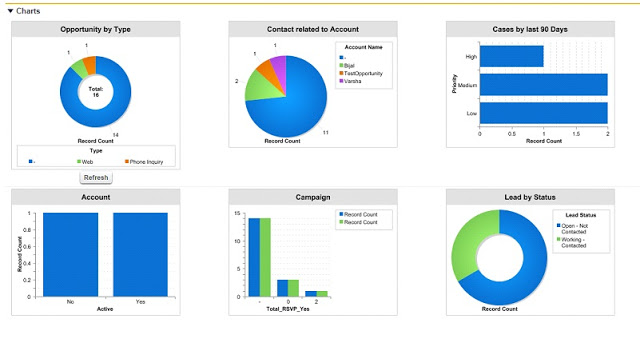
Done! Our Visualforce page is displayed with report charts, as shown below:
Reporting API comes with its own share of drawbacks. I have listed a few of them below:
Its disadvantages notwithstanding, Reporting API has proved great for implementations with strict time constraints, which require an effective UI for displaying reports dynamically in Salesforce. Give it a try and let me know how was your experience.

Context-trained AI agent delivering noise-free, cost-efficient conversational intelligence

We offer functional, technical, and implementation support, minimizing disruptions to your operations.

AI or Gen AI, consulting, development or model building. You ask for any of them. We will deliver.
Insights from our team of experts who deliver digital software day in and day out.
 Thank you for signing up!
Thanks a lot for your interest. You are already a subscriber. You will receive your first newsletter soon.